Dashboard
Dashboard
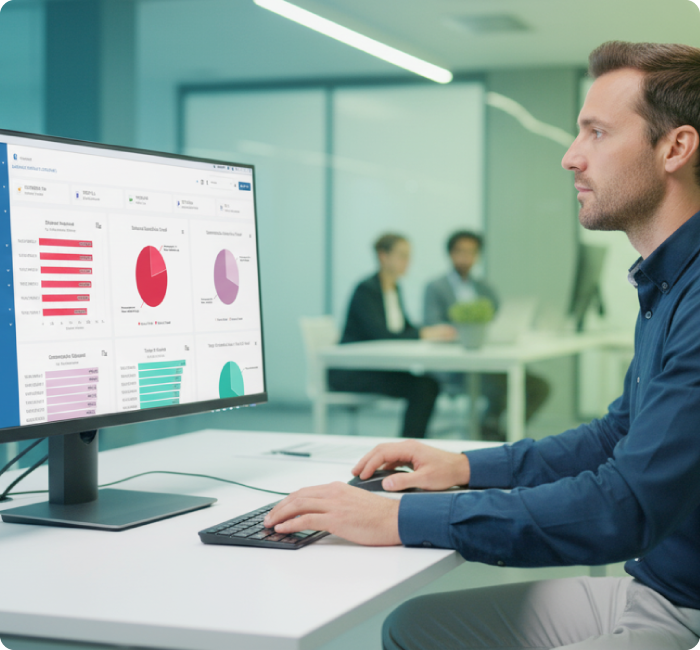
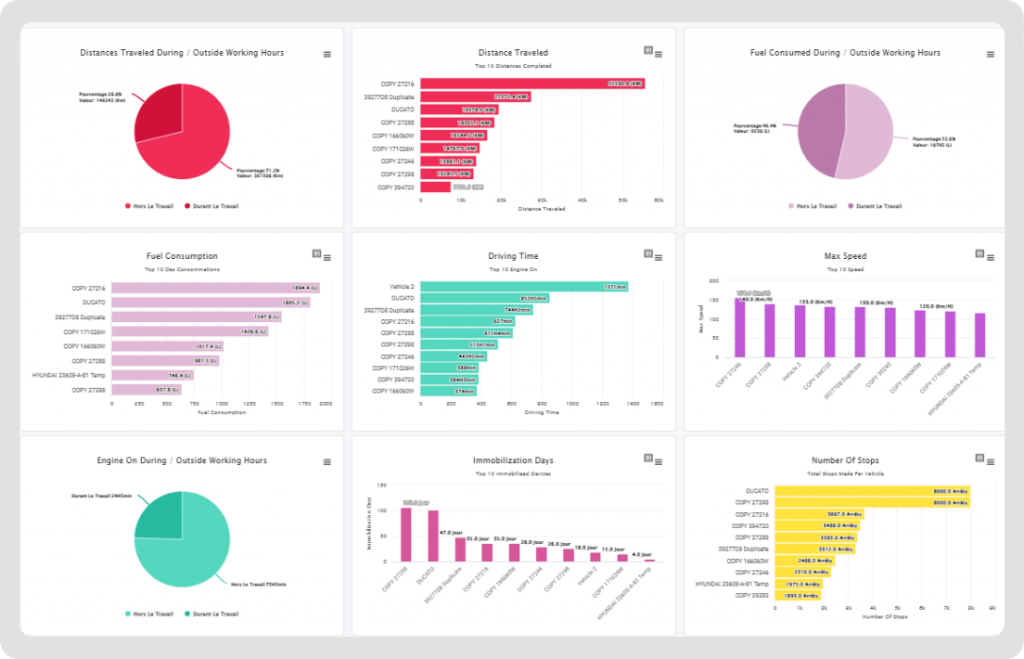
Access real-time data and analytics on a dynamic dashboard for in-depth insights into fleet operations.

Goal Tracking
Set performance benchmarks and monitor progress through dynamic KPI visualizations. The dashboard aligns team efforts with organizational goals, enabling continuous performance assessment and fostering a data-driven approach to achieving operational excellence.
Enhanced Decision-Making Through Visual Data
The Dashboard Module provides visual representations of key performance indicators, such as fuel consumption and driving time. These intuitive graphs help users quickly assess fleet performance, enabling more effective and timely decisions.


Proactive Problem Identification
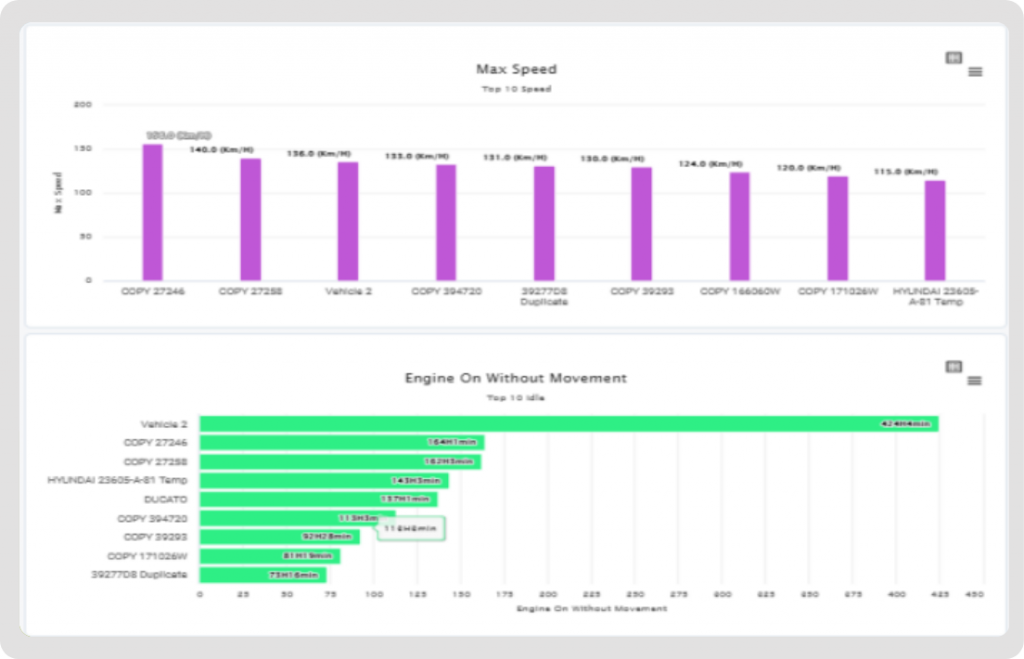
By tracking metrics like maximum speed and idle time, users can identify and address potential problems before they escalate. The dashboards help highlight areas needing improvement, supporting preventive measures and long-term success.